AQtime is a performance profiling and memory/resource debugging toolset.
AQtime is built with one key objective — to help you completely understand how your programs perform during execution.
Product Overview
AQtime is an industrial-level profiling/debugging workbench, built for day-in, day-out, easy, productive tuning of your applications — so they run smoothly and efficiently and do not contain leaks, bugs or potential bugs. With AQtime on your development machine, you will know what your application is doing from any angle, and at any desired level of detail.
Using its integrated set of performance and debugging profilers, AQtime collects crucial performance, memory and resource allocation information at runtime and delivers it to you both in summarized and detailed form, with all of the tools you need to begin your source code optimization process. This is all done without modifying the application’s source code! AQtime can run as a stand-alone application, or it can be integrated into Microsoft Visual Studio or Embarcadero RAD Studio (Delphi and C++Builder) which gives you the power to optimize your applications without leaving the IDE.
AQtime includes profiling for:
- Performance bottlenecks
- Memory leaks
- Code coverage analysis
- Fault simulation
AQtime is a TOTAL solution for professional Windows and .NET developers that want to eliminate guesswork during development and deliver rock solid programs when the project is complete. Via its unrivaled reporting and test result analysis architecture, AQtime does not just tell you that there are bugs, performance bottlenecks or memory leaks in your project — it shows you exactly which module, class, routine or line of code is causing the problem so you can go to work and quickly eliminate it!
Key Features
Application Performance Profiling / C/C++, Delphi, .Net, and Java Profiling
Performance Profiling VideoAQtime lets you find performance bottlenecks in 32-bit and 64-bit C/C++, Delphi, .NET, Java profiling, and Silverlight applications and scripts. You can use AQtime as a standalone performance profiler, or integrated into Microsoft Visual Studio and Embarcadero RAD Studio IDEs for improved productivity.
Choose the Level of Details
AQtime offers multiple modes for application performance analysis.
You can start with a quick performance inspection using the lightweight Sampling profiler and then drill deeper into the hot spots using the more accurate Performance profiler.
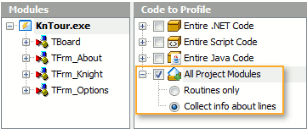
Profile What You Need
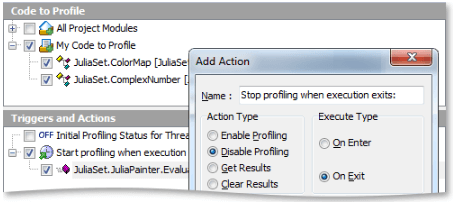
With AQtime, you can focus on specific parts of your source code and select the exact source files, classes or methods to performance profile or exclude from profiling. You can start and stop profiling when you need it at any time during the application run. AQtime can also start and stop profiling automatically when the application execution enters or exits a specific method. All of this helps minimize the profiling overhead so that your application runs at its full potential the rest of the time.
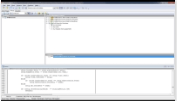
Insightful Performance Reports
AQtime’s performance profiling reports help you easily identify functions and call paths that are causing the greatest impact on your application performance. Drill down from summary to detailed performance reports to understand what code needs performance tuning.
Memory Profiling
Fixing Memory Leaks VideoAQtime helps you pin down memory and resource leaks in your application to ensure high application efficiency and stability. You can use AQtime as a standalone memory allocation debugger, or integrated into Microsoft Visual Studio and Embarcadero RAD Studio.
Find and Monitor Memory Leaks
Using AQtime, you can detect various types of memory and resource leaks :
- Class instance leaks
- Unreleased memory blocks
- Handle leaks (file, mutex, semaphore, registry handles and so on)
- GDI and GCI+ resource leaks (bitmaps, fonts and so on)
- COM and reference count leaks
- Print Spooler memory leaks
Monitor Memory Allocation in Real Time
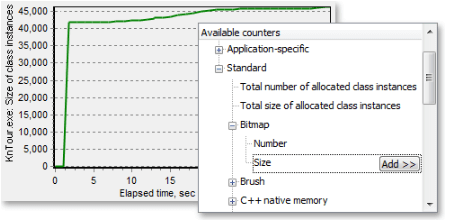
AQtime Memory Monitor shows your application’s memory and resource allocations in real time to help you detect excessive memory and resource usage. You can monitor total memory usage, memory usage by category (heap, reserved virtual memory and so on), resource types (brushes, fonts, etc.), as well as individual classes used in your application. At any time, you can capture a complete memory snapshot for more comprehensive application memory analysis.
Code Coverage Analysis
Coverage Profiling VideoAQtime provides code coverage analysis for C/C++, .NET, Silverlight, Java, and Delphi applications. AQtime can be used to measure code coverage during manual application runs, as well as integrated into your automated regression tests for continuous coverage analysis.Find Unused or Untested Code
AQtime’s code coverage analysis shows you which source files, functions and lines of code have been covered by tests, are untested or only partially tested. This helps you know what additional tests to create and how to improve your existing tests. Want to get coverage for a specific source file, namespace, class or method? AQtime lets you easily exclude or include code into coverage analysis, so you can focus on specific areas of interest. You can define filters from the class viewer and from coverage results.
Convenient Analysis of Coverage Data
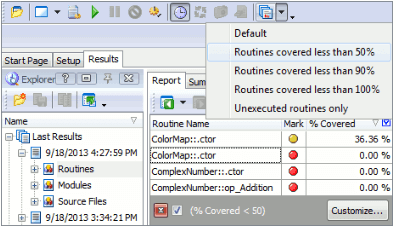
Analyze code coverage reports with any level of details – compiled modules, source files or functions. Predefined filters let you limit the report to only code with no coverage or less than a fixed coverage value. AQtime lets you compare past coverage results with current results side-by-side. You can easily see how your project coverage changes as new code is written, existing code is changed and new tests are added.Using AQtime, you can merge code coverage results from multiple test runs to get aggregate coverage statistics for your entire project. This is useful for large projects where testing is performed in multiple environments.
IDE Integration
Visual Studio Integration VideoWork smarter and optimize your code in Microsoft Visual Studio or Embarcadero RAD Studio. Find performance issues, memory and resource leaks right from your IDE.
AQtime can run as a standalone tool, or integrated into Microsoft Visual Studio and Embarcadero RAD Studio IDEs. With one click you can analyze your application performance, memory usage, code coverage and other metrics, then optimize your code and repeat—all without leaving the IDE.
Fault Simulation
AQtime includes a Failure Emulator that lets you simulate faults during your application run and monitor their impact on the application behavior. This way you can:
- Evaluate the effectiveness of application’s built-in fault detection and recovery code
- Determine the performance loss due to failures
- Identify dependability bottlenecks that may need to be addressed using fallback solutions
AQtime integrates with Microsoft Visual Studio and Embarcadero RAD Studio, allowing you to perform runtime fault injection while debugging your application in the IDE.
No Source Code Changes
AQtime’s Failure Emulator does not need any changes in your application code. You can inject faults even into applications with no source code available.
Achieve Higher Code Coverage
Software failures can be difficult to reproduce in normal operating conditions. AQtime’s Failure Emulator lets you simulate failures with high accuracy and repeatability, allowing you to easily reach the exception handling and recovery code.
Simulate Various Fault Types
AQtime supports emulating different faults:
- File system errors (missing or locked files, access denied, etc.)
- Registry errors (missing or read-only values, access denied and so on)
- Low memory
- COM errors (missing COM servers, unregistered ProgIDs, etc.)
- Condition-triggered faults (for example, each Nth time or Nth time onwards)
Supported Applications and Technologies
With application runtime analysis for C/ C++, Delphi, .NET, ASP.NET, Silverlight, Java and scripts, you can profile both native and managed modules, even simultaneously.
With AQtime you can profile:
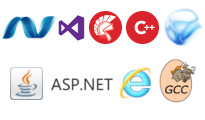
- C/C++ applications (Visual C++, C++Builder, GCC, Intel C++ )
- Delphi applications
- .NET 1.x–4.5 applications
- Silverlight 4 applications
- Java profiler for 1.5 and 1.6 applications
- 64-bit applications
- JavaScript, JScript and VBScript scripts
Whether you are developing standalone Windows applications, Windows services, IIS, ASP.NET, XBAP, COM, DCOM and COM+ applications, AQtime is the right profiler for you.
Selective Profiling
Selective Profiling VideoWith AQtime, you can profile your whole application, or just specific regions. When you are searching for a problem, profiling the entire application helps you find problematic regions. However, when you are working on a particular problem, capturing too much profiling data may cause unwanted overhead and distract you from your goal.
Exclude and Include Code into Profiling
AQtime’s profiling areas let you specify what exactly you want to profile. You can quickly select namespaces, classes and methods to profile or exclude from profiling using drag-and-drop from the class view.
Start and Stop Profiling On Demand
AQtime lets you set up triggers and actions to start and stop profiling at any time during the application run and automatically on a specific function entry or exit. You can also control profiling from your application using AQtime’s SDK. This lets you better focus on a specific problem you are working on, with the rest of your code running without any overhead.
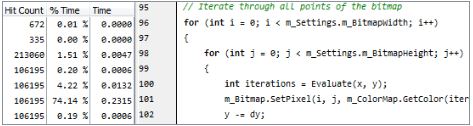
Function-Level and Line-Level Profiling
AQtime offers both function-level and line-level profiling, allowing you to choose the level of details you need. You can start with function-level analysis to identify the primary candidates for optimization and then collect line-level data for more deep analysis of the found bottlenecks.
Attaching to Process
You can attach AQtime to an already running application and start profiling straight away without having to restart the application. This is an easy way to analyze the application performance or memory after it reaches a certain state.
Ignore Standard Library Methods
AQtime lets you automatically filter out standard library methods from profiling, so that you can focus on your application code. The filter applies to native-code libraries (VCL, ATL, MFC and others) and .NET Framework libraries.
Rich Detailed Reports
AQtime delivers comprehensive yet easy-to-understand reports that allow developers to easily locate performance bottlenecks, memory and resource leaks and other issues in applications, and optimize the source code appropriately.
AQtime gives you summary and detailed profiling reports for enhanced data analysis:
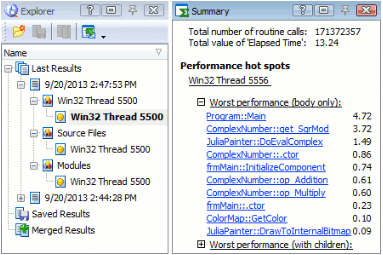
- The summary provides a high-level overview of profiling results and pin-points the top ten functions that need to be optimized, allowing you to quickly focus optimization where it’s needed most.
- The detailed report includes profiling results on all modules, threads, source files, classes and functions, down to lines of source code. This includes accurate function-level and line-level timings, hit counts, memory allocations and many other metrics a developer needs to analyze and solve even the most complex problems.
Visualizing Critical Paths
Profiling reports include the call tree of all methods in your application with highlighted critical paths that contribute most to the execution time, memory allocation or other metrics. The call tree allows you to easily pinpoint the exact source of performance bottlenecks and leaked memory.
Navigating From Results to Source Code
Profiling results are synchronized with AQtime’s integrated code viewer, allowing you to quickly see the actual code that is causing bottlenecks.
Getting Results While Profiling Is in Progress
AQtime generates the report automatically at the end of the profiling session. You can also capture profiling results at any time during your application run to analyze issues as they happen, or to prepare multiple result sets for later comparison.
Comparing Results
AQtime lets you quickly compare past profiling results with the current results so that you can answer the all-important question, “Did my code changes improve the state of my application, or did they lead to other problems?”
Exporting Results
AQtime allows you to print reports or export them to Microsoft Excel, HTML, XML, text files or databases, providing an easy way to share profiling results with your colleagues or publish them on an intranet website.